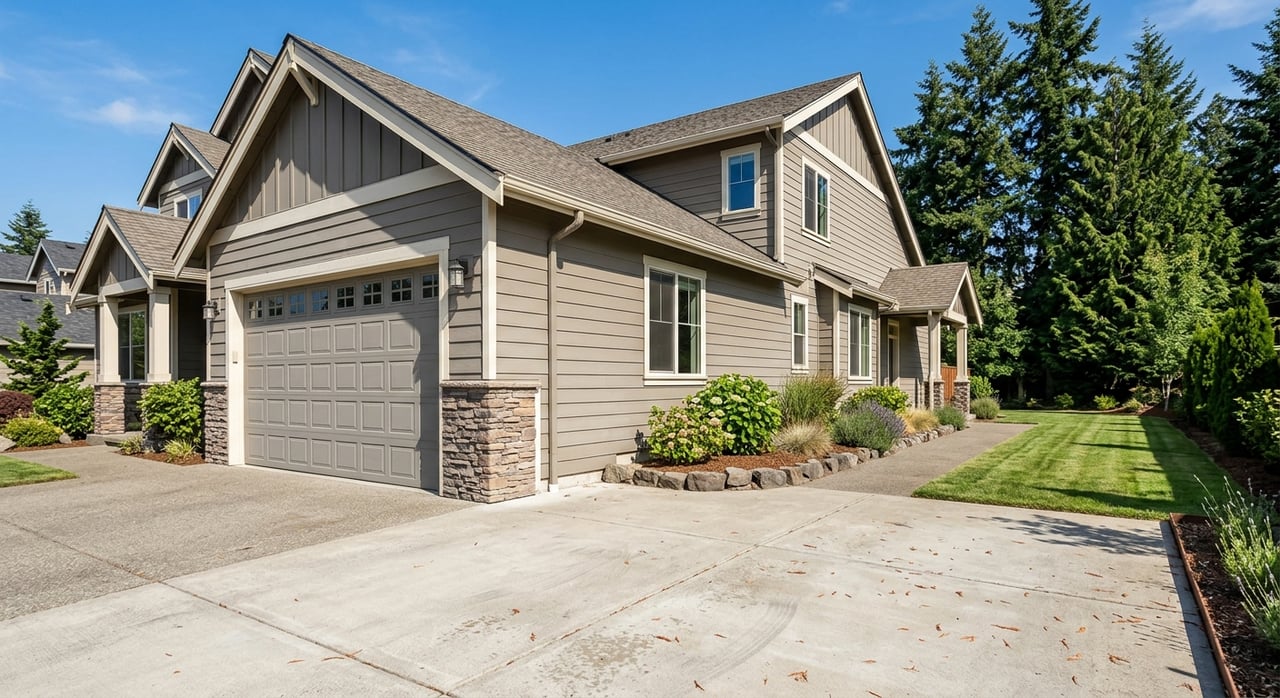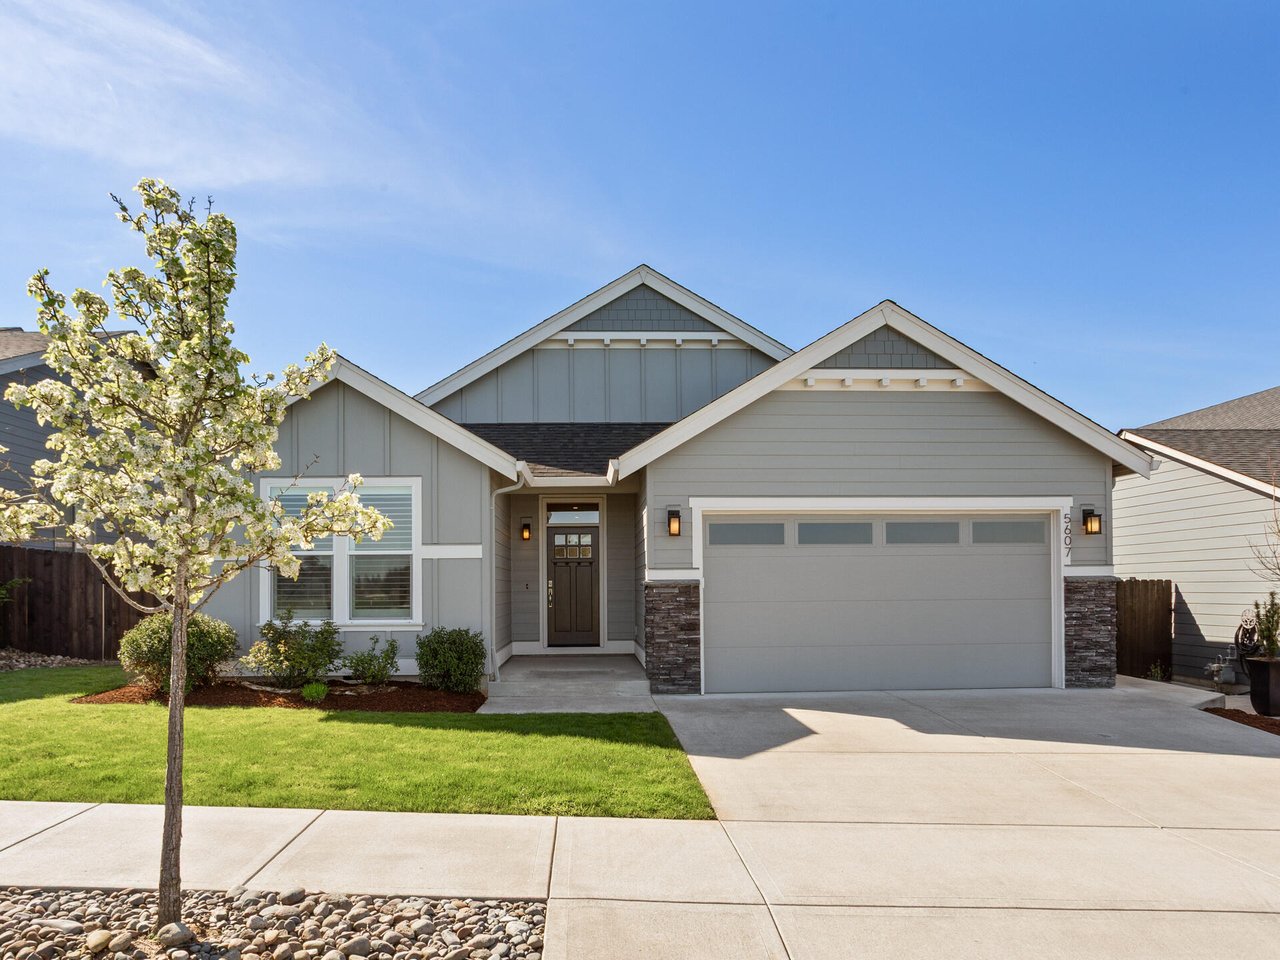
Real Estate Market in Vancouver, Washington (Late 2025 Update)
As we approach the end of 2025, the real estate market in Vancouver, Washington—part of the broader Southwest Washington region in Clark County—shows signs of stabilization amid national economic influences like interest rates and affordability challenges. Situated across the Columbia River from Portland, Oregon, Vancouver blends suburban charm with commuter convenience, appealing to families, professionals, and investors. This update is based on the latest October 2025 data from RMLS, focusing on residential trends in Clark County (which includes Vancouver). Whether you're a buyer, seller, or investor, here's a breakdown of the key metrics and what they mean for the market.Current Home Prices and TrendsHome prices in Vancouver and Clark County have experienced modest fluctuations in 2025, reflecting a cooling trend after years of strong appreciation. Key highlights from October:
Inventory and Days on MarketInventory levels suggest a balanced market, with some advantages for sellers in ready-to-move-in homes:
Sales ActivityActivity has moderated as the year winds down, consistent with seasonal patterns:
- The average sale price was $622,900, down 2.3% from October 2024's $637,600 but up 1.0% from September 2025's $616,500.
- The median sale price stood at $539,300, a 3.7% decrease year-over-year from $560,000 and a 1.0% dip month-over-month from $545,000.
- Year-to-date through October, the average sale price is $624,200 (up 1.7% from 2024), and the median is $549,900 (up 1.8%).
- Under $500K: 46.9% of sales (down from 55.1% in 2023 but up from 35.1% in 2024).
- $500K–$700K: 33.2%.
- Over $700K: 19.9%, showing strength in luxury segments.
|
Metric
|
October 2025
|
Change YoY
|
Change MoM
|
|---|---|---|---|
|
Average Sale Price
|
$622,900
|
-2.3%
|
+1.0%
|
|
Median Sale Price
|
$539,300
|
-3.7%
|
-1.0%
|
|
Year-to-Date Average
|
$624,200
|
+1.7%
|
N/A
|
|
Year-to-Date Median
|
$549,900
|
+1.8%
|
N/A
|
- Overall inventory held steady at 3.6 months in October, compared to 2.9 months in 2024.
- For purchase- and occupancy-ready listings (81.7% of active inventory), supply is tighter at 2.9 months, with 1,543 such properties available.
- Total market time increased to 68 days, up 7.9% year-over-year from 63 days and 4.6% from September's 65 days.
|
Year
|
January
|
February
|
March
|
April
|
May
|
June
|
July
|
August
|
September
|
October
|
|---|---|---|---|---|---|---|---|---|---|---|
|
2023
|
2.5
|
1.8
|
1.4
|
1.5
|
1.7
|
1.8
|
1.9
|
1.9
|
2.5
|
2.8
|
|
2024
|
3.2
|
2.5
|
2.1
|
2.5
|
2.6
|
2.8
|
2.6
|
3.0
|
3.3
|
2.9
|
|
2025
|
3.1
|
3.0
|
3.0
|
2.9
|
3.4
|
3.3
|
3.5
|
3.6
|
3.6
|
3.6
|
- New listings: 655, down 3.7% from 680 in October 2024 but up 1.1% from September's 648.
- Pending sales: 527, a 9.0% drop year-over-year from 579 and 12.2% from September's 600.
- Closed sales: 530, down 3.8% from 551 last October and 2.2% from September's 542.
- Salmon Creek: Median $570,000, with 58 active listings and 44 days on market.
- Camas: Higher-end at $770,000 median, 199 active listings, average price $875,000 in October.
- Battle Ground: Affordable entry at $545,000 median, but longer market time (92 days).
- Ridgefield/La Center: Growing areas with medians around $622,500, strong investor interest.
- Buyers: Leverage the 3.6 months of inventory for better deals—focus on ready-to-occupy homes in areas like Hazel Dell or Orchards.
- Sellers: Price realistically and emphasize features like energy efficiency or proximity to amenities to reduce market time.
- Investors: Look at multifamily or land in growing suburbs like Camas or Ridgefield for solid returns.